Plots multiple pairwise variable scores in a matrix layout.
Usage
plot_pairwise(
  scores,
  var_order = "seriate_max",
  score_limits = NULL,
  inner_width = 0.5,
  center_level = "all",
  na.value = "grey80",
  pal = "Blue-Red 3",
  diag_label_size = 3,
  interactive = FALSE
)
Arguments
- scores
The scores for the matrix plot. Either of class
pairwiseor identical in structure to object of classpairwise.- var_order
The variable order to be used. The default NULL means variables in are ordered alphabetically. A value of "seriate_max" means variables are re-ordered to emphasize pairs with maximum abolute scores. A value of "seriate_max_diff" means variables are re-ordered to emphasize pairs with maximum score differences. Otherwise var_order must be a subset of variables in scores.
- score_limits
a numeric vector of length specifying the limits of the scale.
- inner_width
A number between 0 and 1 specifying radius of the inner bullseye.
- center_level
Specifies which level of group goes into the innter bullseye. Defaults to "all".
- na.value
used for scores with a value of NA
- pal
If provided, should name a one of the sequential or diverging palettes from package colorspace. See
colorspace::hcl_palettes(). Otherwise defaults to a blue-red scheme.- diag_label_size
used for diagonal variable labels, defaults to 3.
- interactive
defaults to FALSE
Value
A girafe object if interactive==TRUE, otherwise a ggplot2.
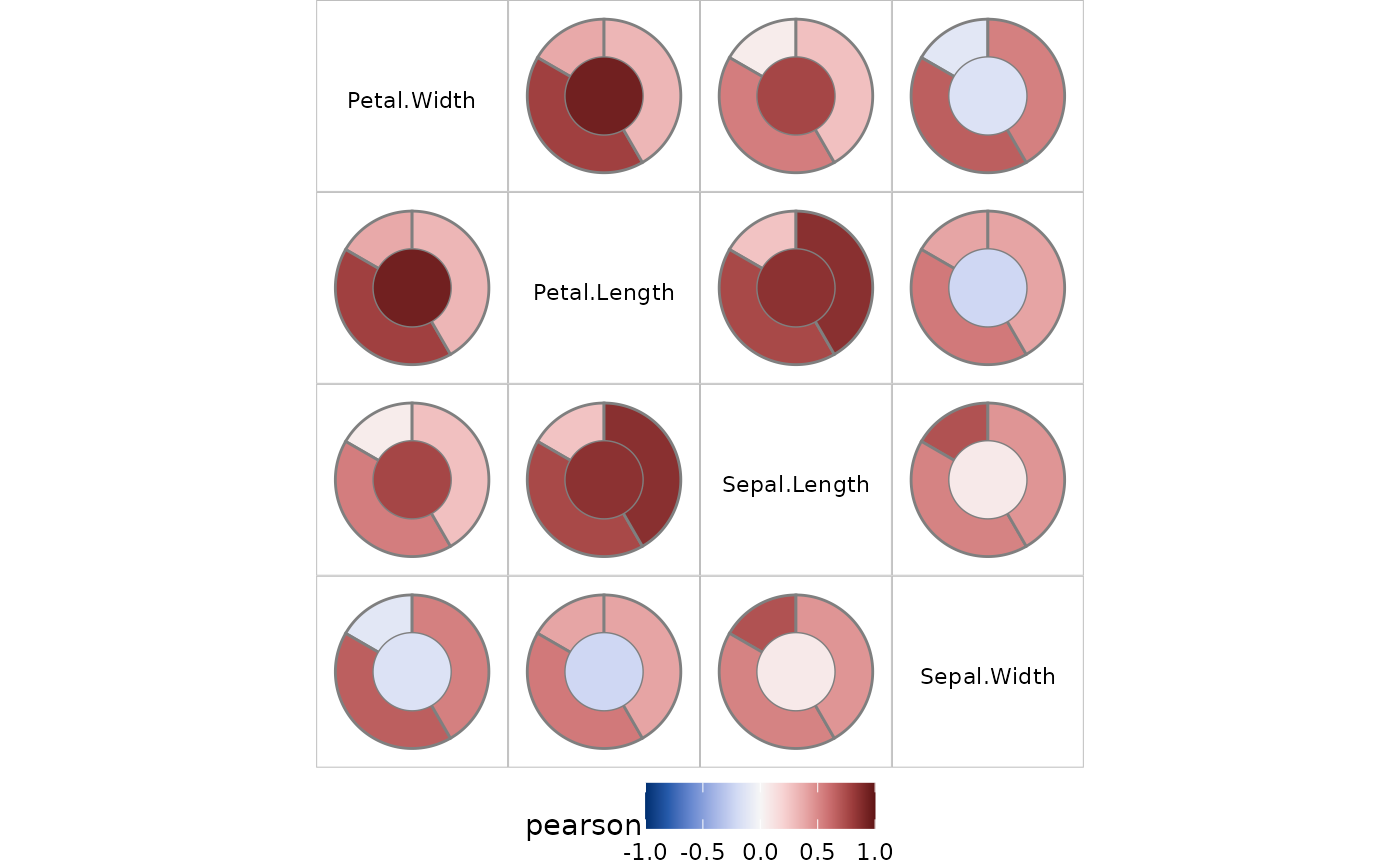
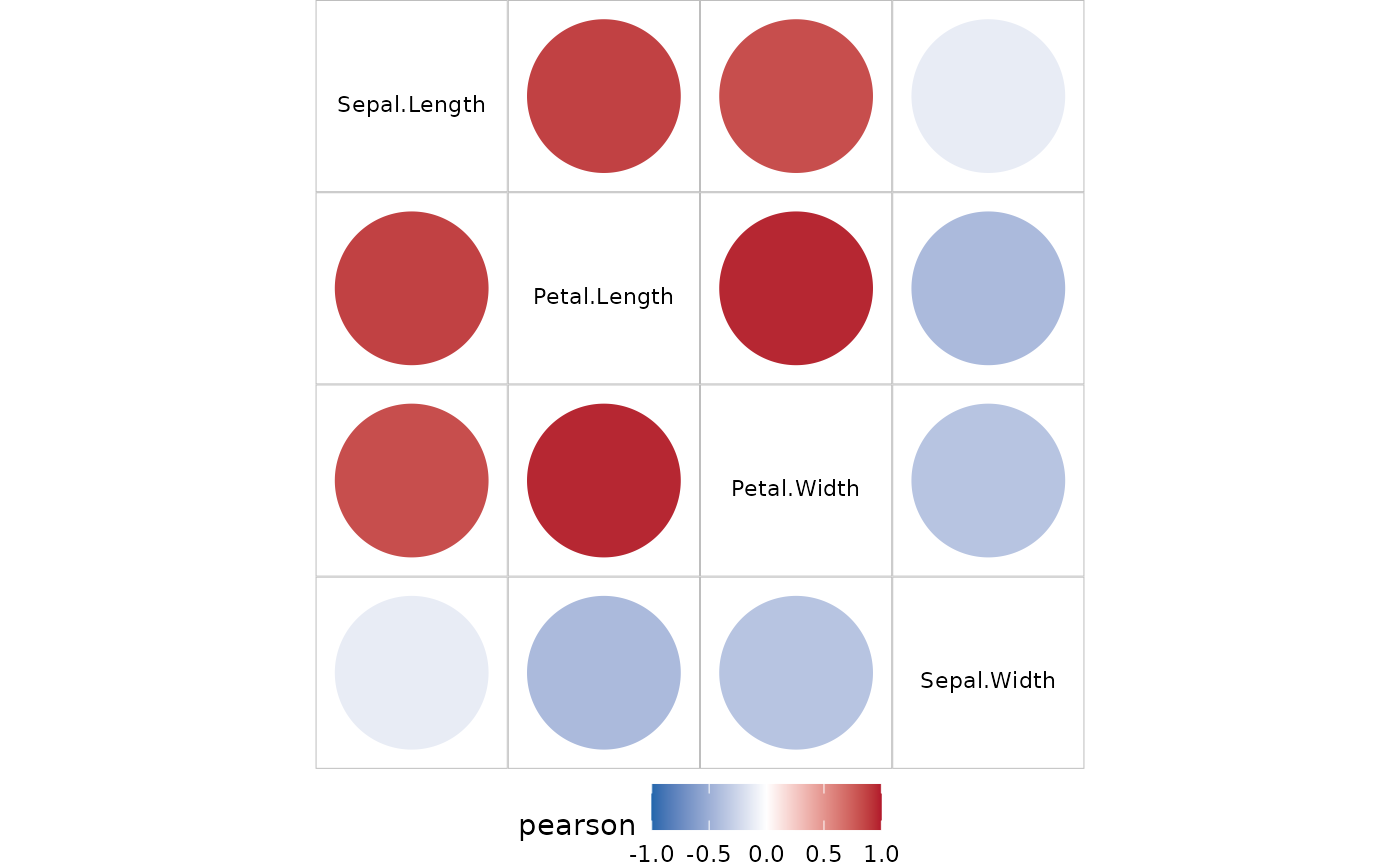
If scores has one value for x,y pair, then a filled circle is drawn with fill representing the score value. If there are multiple values for each x,y pair then the filled circle is split into wedges, with the wedge fill representing the values.
If some rows have group=center_level, then the glyph is drawn as a bullseye.
If scores has a column n, then this is used to weight the slices. See the third example below.
Examples
pair_cor(iris) |> plot_pairwise()
 pairwise_scores(iris,by="Species") |> plot_pairwise()
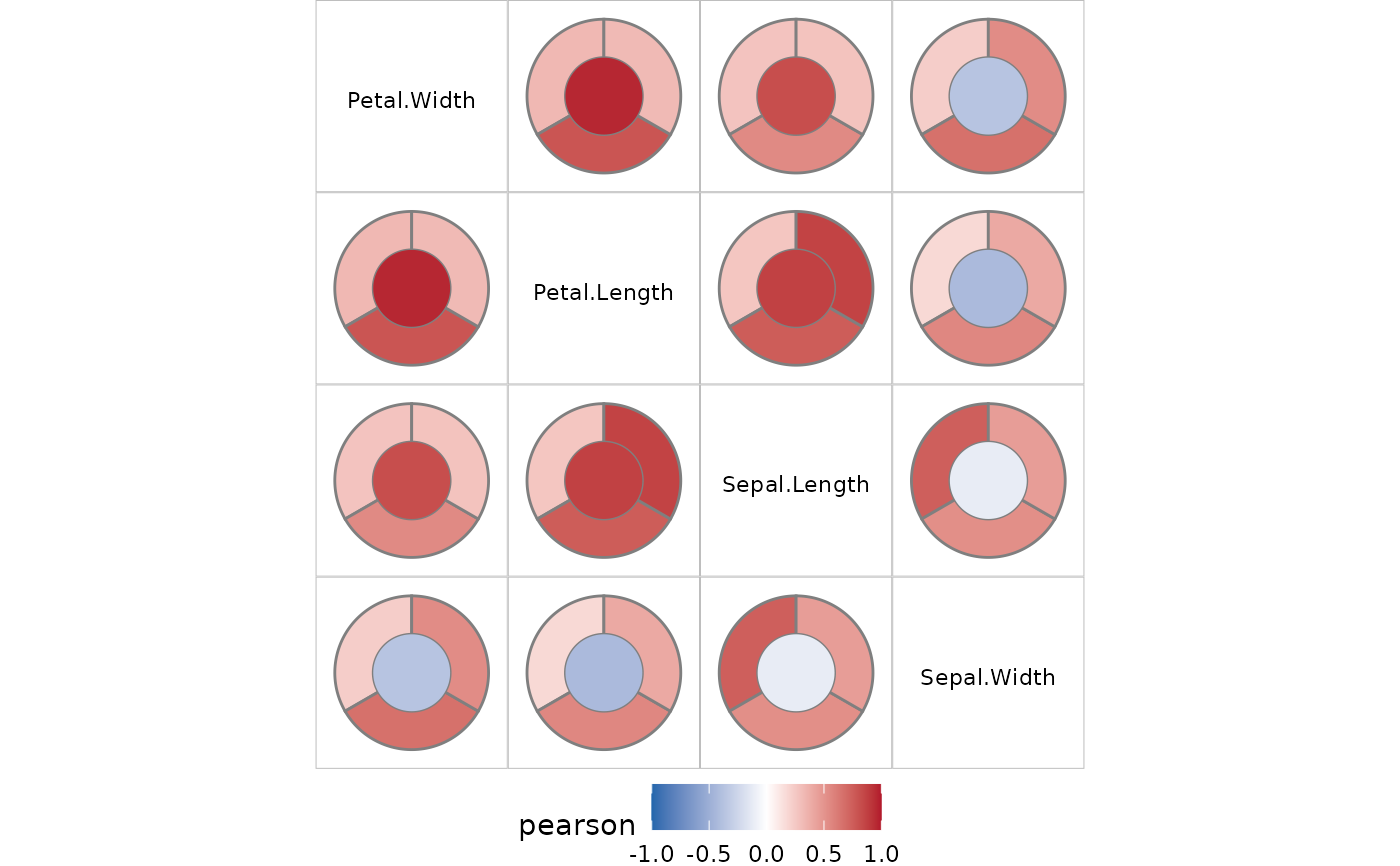 pairwise_scores(iris[-(1:30),],by="Species", add.nobs=TRUE) |> plot_pairwise()