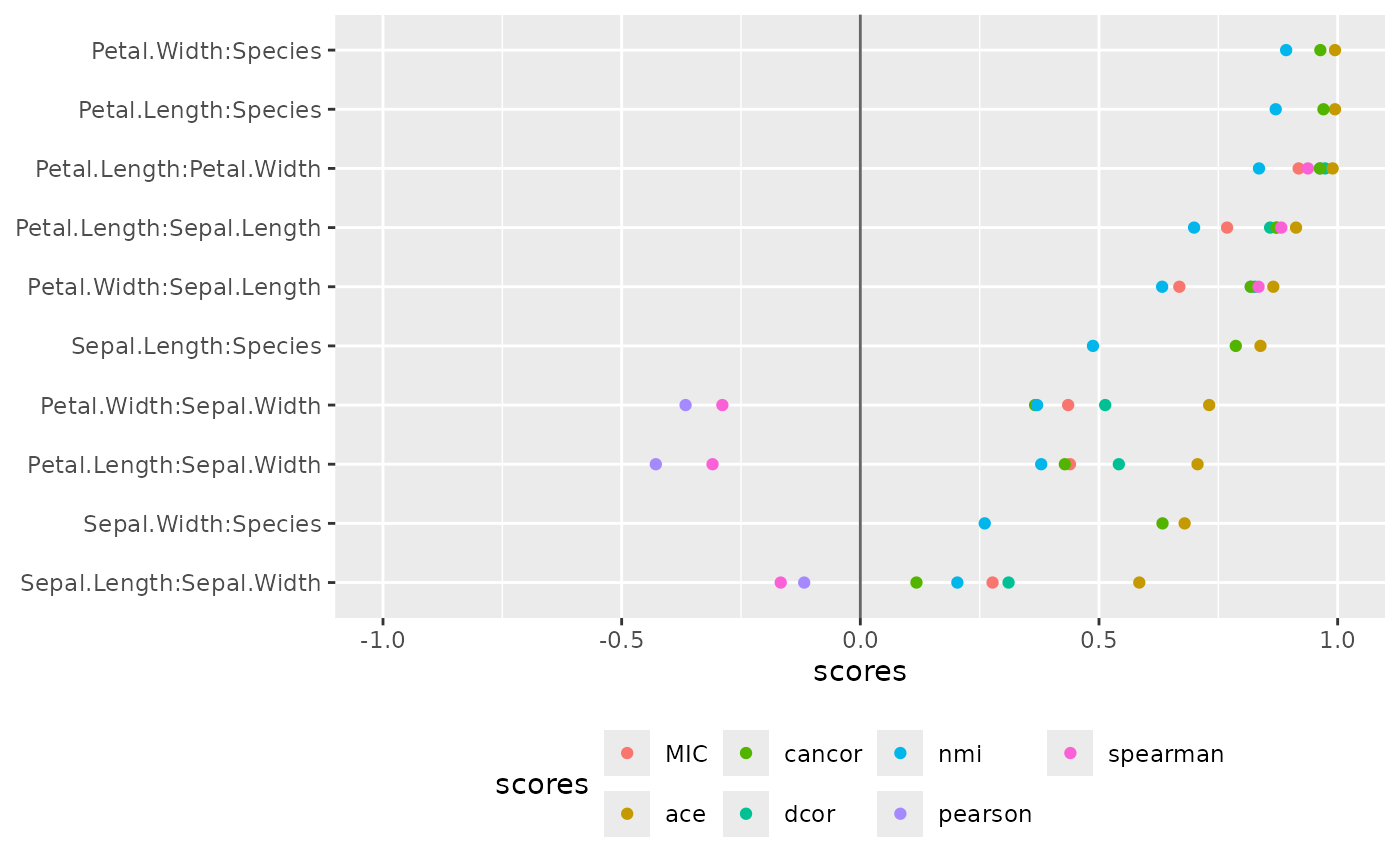
Plots the calculated measures of association among different variable pairs for a dataset in a linear layout.
Usage
plot_pairwise_linear(
  scores,
  pair_order = "seriate_max",
  geom = c("point", "tile"),
  add_lines = FALSE,
  score_limits = NULL,
  na.value = "grey80",
  pal = "Blue-Red 3",
  interactive = FALSE
)
Arguments
- scores
A tibble with the calculated association measures for the matrix plot. Either of class
pairwiseor identical in structure to object of classpairwise.- pair_order
The variable pair order to be used. The default NULL means pairs are in order of their first appearance in
scores. A value of "seriate_max" means pairs are in order of maximum absolute scores. A value of "seriate_max_diff" means pairs are in order of maximum scores difference.- geom
The geom to be used. Should be "point" or "tile".
- add_lines
When geom= "point" is used, should the points be connected by lines? Defaults to FALSE.
- score_limits
a numeric vector of length specifying the limits of the scale.
- na.value
used for geom_tile with a value of NA
- pal
For geom="title" only. If provided, should name a one of the sequential or diverging palettes from package colorspace. See
colorspace::hcl_palettes(). Otherwise defaults to a blue-red scheme.- interactive
defaults to FALSE
Examples
plot_pairwise_linear(pairwise_scores(iris))
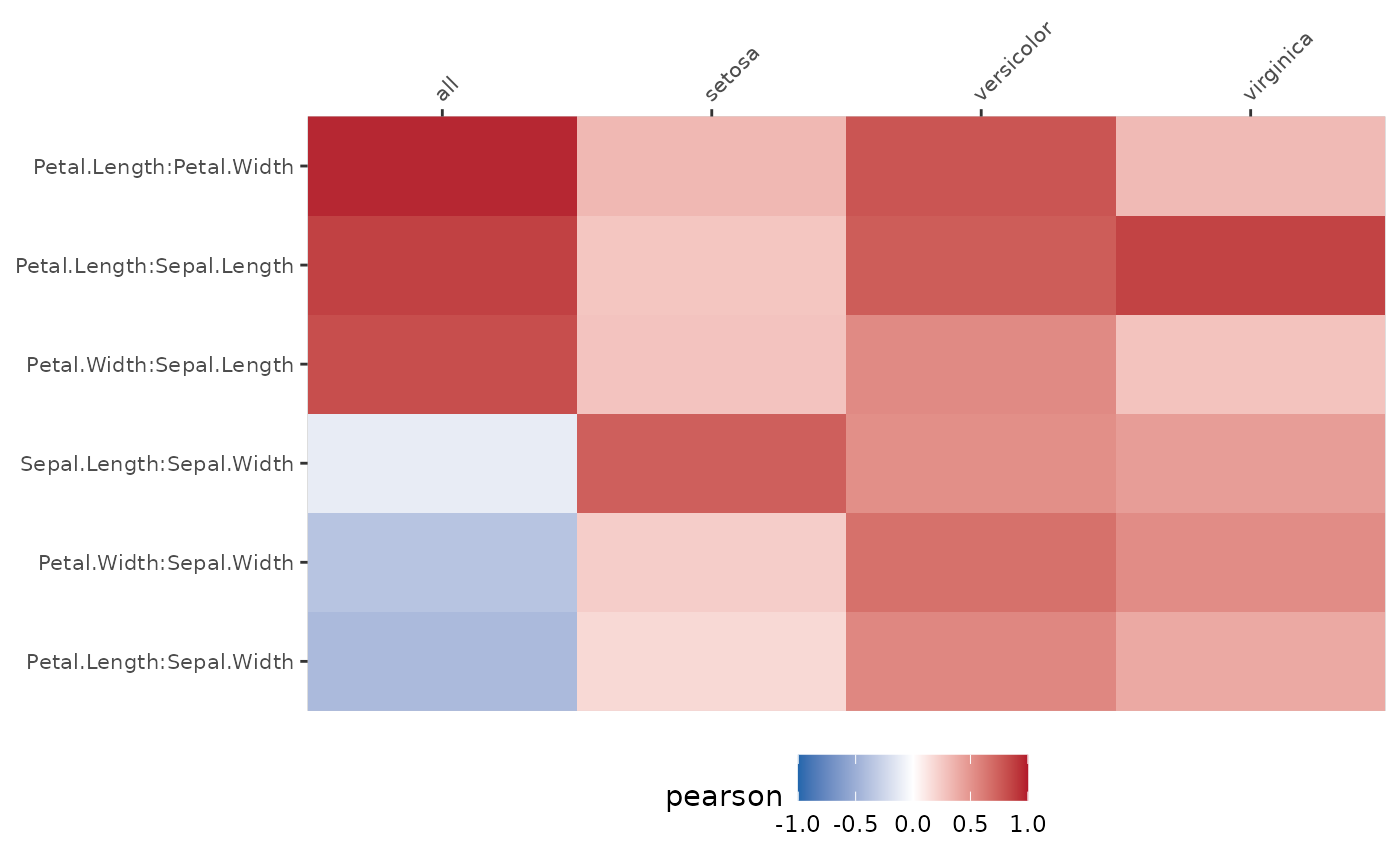
 plot_pairwise_linear(pairwise_scores(iris,by="Species"))
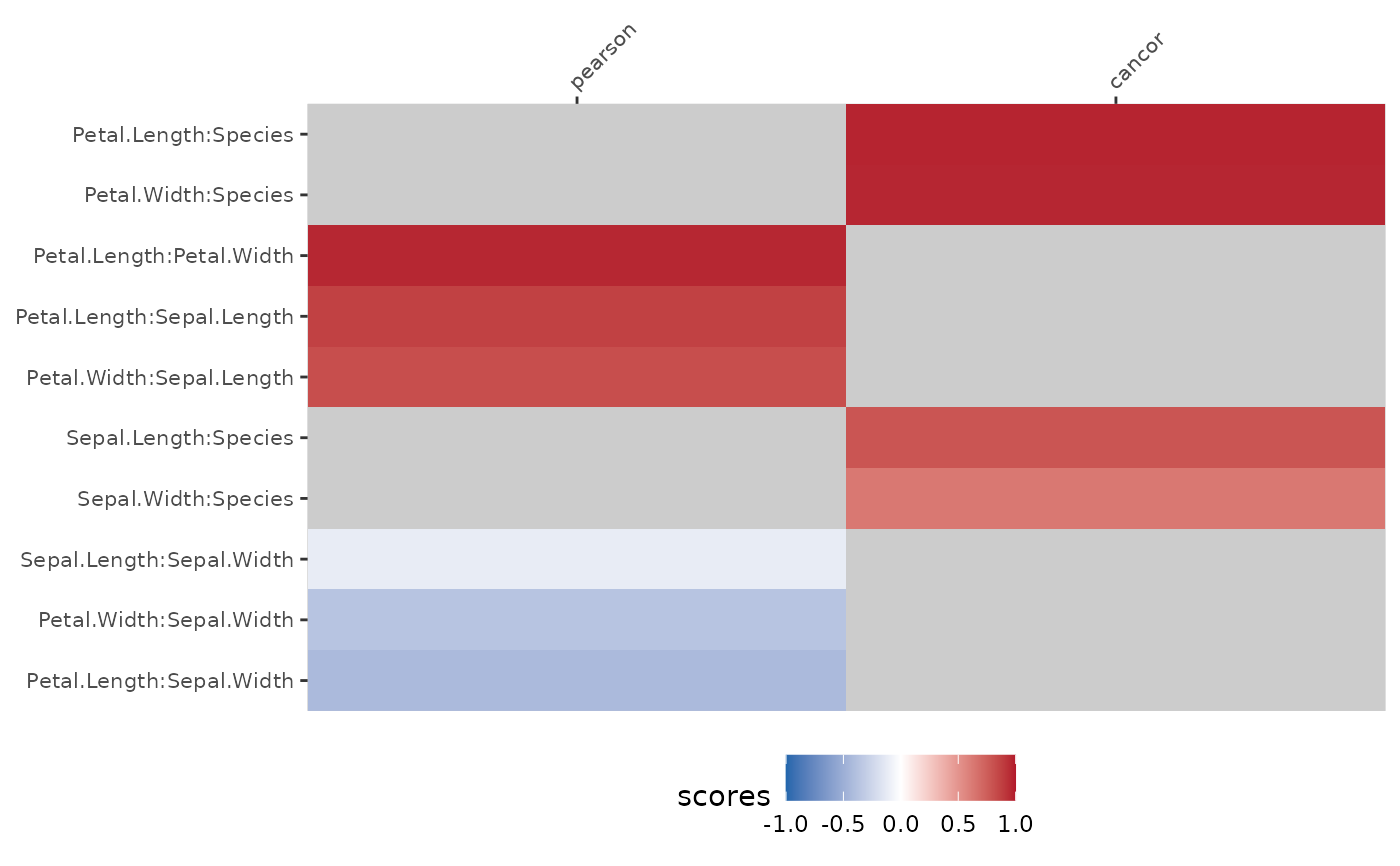
 plot_pairwise_linear(pairwise_multi(iris), geom="tile")